Reports and Histograms
Trait/Marker/Inbreeding Histograms
Section titled “Trait/Marker/Inbreeding Histograms”When you make a run using Committed Matings you will see the following Matings To Show options at the top of each histogram:
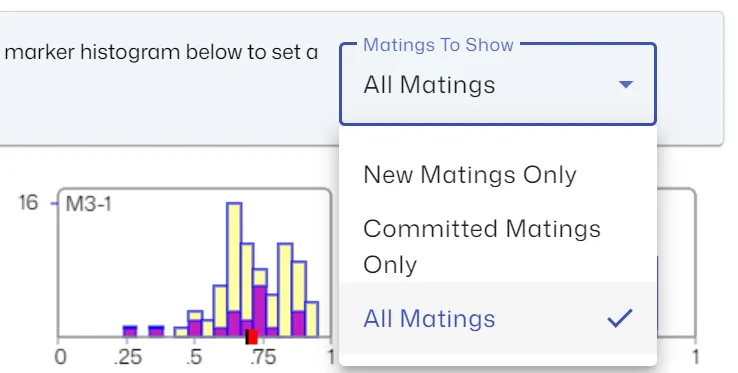
The blue/purple bars are results for New Matings, and these change as the solution evolves. The light-yellow bars are for the Committed Matings, and these are fixed. When viewing All Matings, the Committed Matings bars are stacked on top of the New Matings bars, so that the total height in any one column shows the total number of matings in that value range. The Red ticks show the Average Progeny value for the set of matings chosen (New, Committed or All).
Mating List
Section titled “Mating List”When viewing the Mating List, you will see both committed matings and new matings displayed. See the “Mating Type” column.
Sire Use Detail Dashboard
Section titled “Sire Use Detail Dashboard”When viewing this dashboard, for each sire you will get a breakdown of:
- The number of committed matings
- The number of new matings
- Total matings (sum of committed + new matings)
MatingListSummary|Detail.csv Reports
Section titled “MatingListSummary|Detail.csv Reports”When viewing the MatingListSummary.csv and MatingListDetail.csv reports, you can determine Committed Matings vs New Matings using the EndUse column:
- A value of -1 indicates a Committed Mating
- A value of 1 indicates a New Mating
Frontier
Section titled “Frontier”The Frontier graph gives results for committed and new matings.
Logs Tab
Section titled “Logs Tab”The Logs tab (aka Console) gives results for committed and new matings, except for Sires, MeanF and MaxF, which are for new matings only.