Progeny Inbreeding Histogram
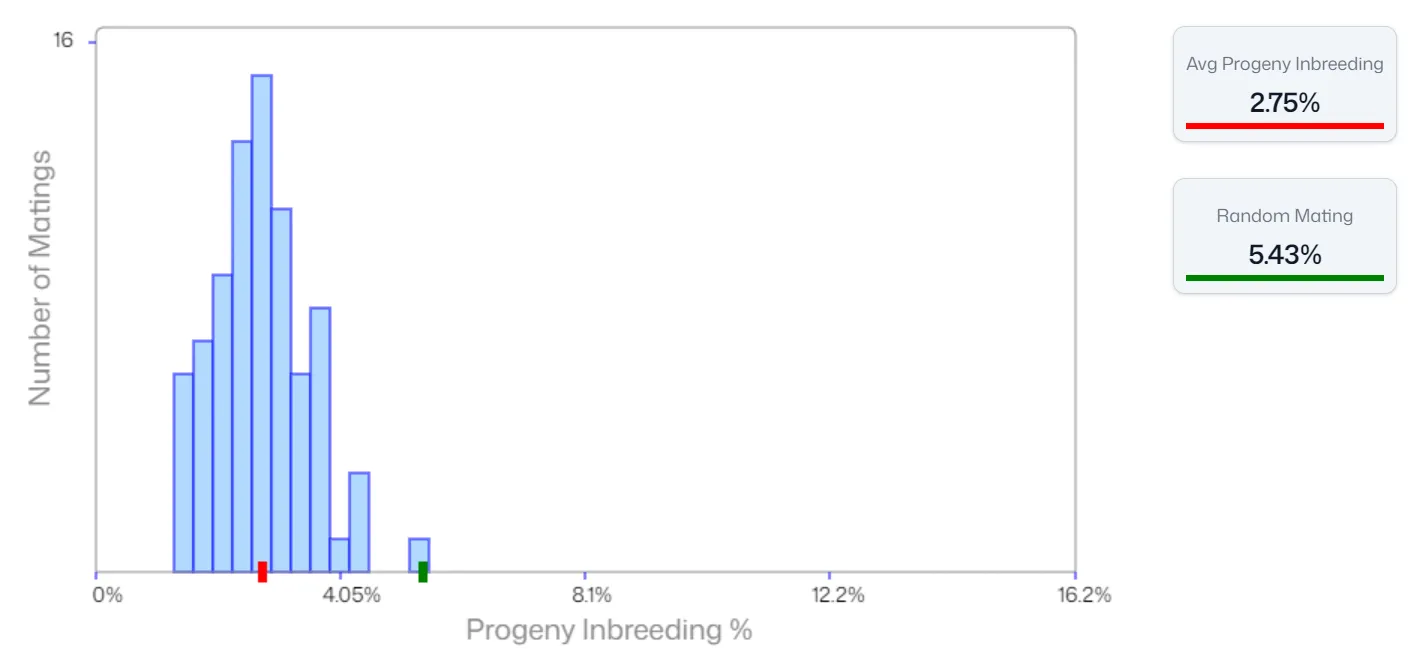
The Progeny Inbreeding Histogram displays the distribution of inbreeding coefficients among offspring in the current mating solution. These coefficients are calculated from pedigree data or, if chosen, from a GRM (Genomic Relationship Matrix).
Red Tick vs Green Tick
Section titled “Red Tick vs Green Tick”- The Red tick represents the Average Progeny Inbreeding (mean F) among progeny for the current mating solution.
- The Green tick represents the predicted Average Progeny Inbreeding (mean F) that would result from random mating among the selected parents, taking into account the number of matings assigned to each parent.
The difference between the Red and Green ticks reveals how optimised Mate Allocation has helped decrease (or increase) progeny inbreeding in the solution.
Managing Inbreeding Outcomes
Section titled “Managing Inbreeding Outcomes”MateSel provides two ways to control inbreeding.
- Set an inbreeding limit
- Reduce average progeny inbreeding via a weighting.
These options can be applied separately or in combination, as detailed in the next pages.