Monitoring and Controlling Markers
The video below provides a summary of how to interpret the marker histograms and control their outcomes:
Interpreting the Marker Histograms
Section titled “Interpreting the Marker Histograms”Under the “Markers” tab in MateSel, the markers in the datafile will be displayed like below:
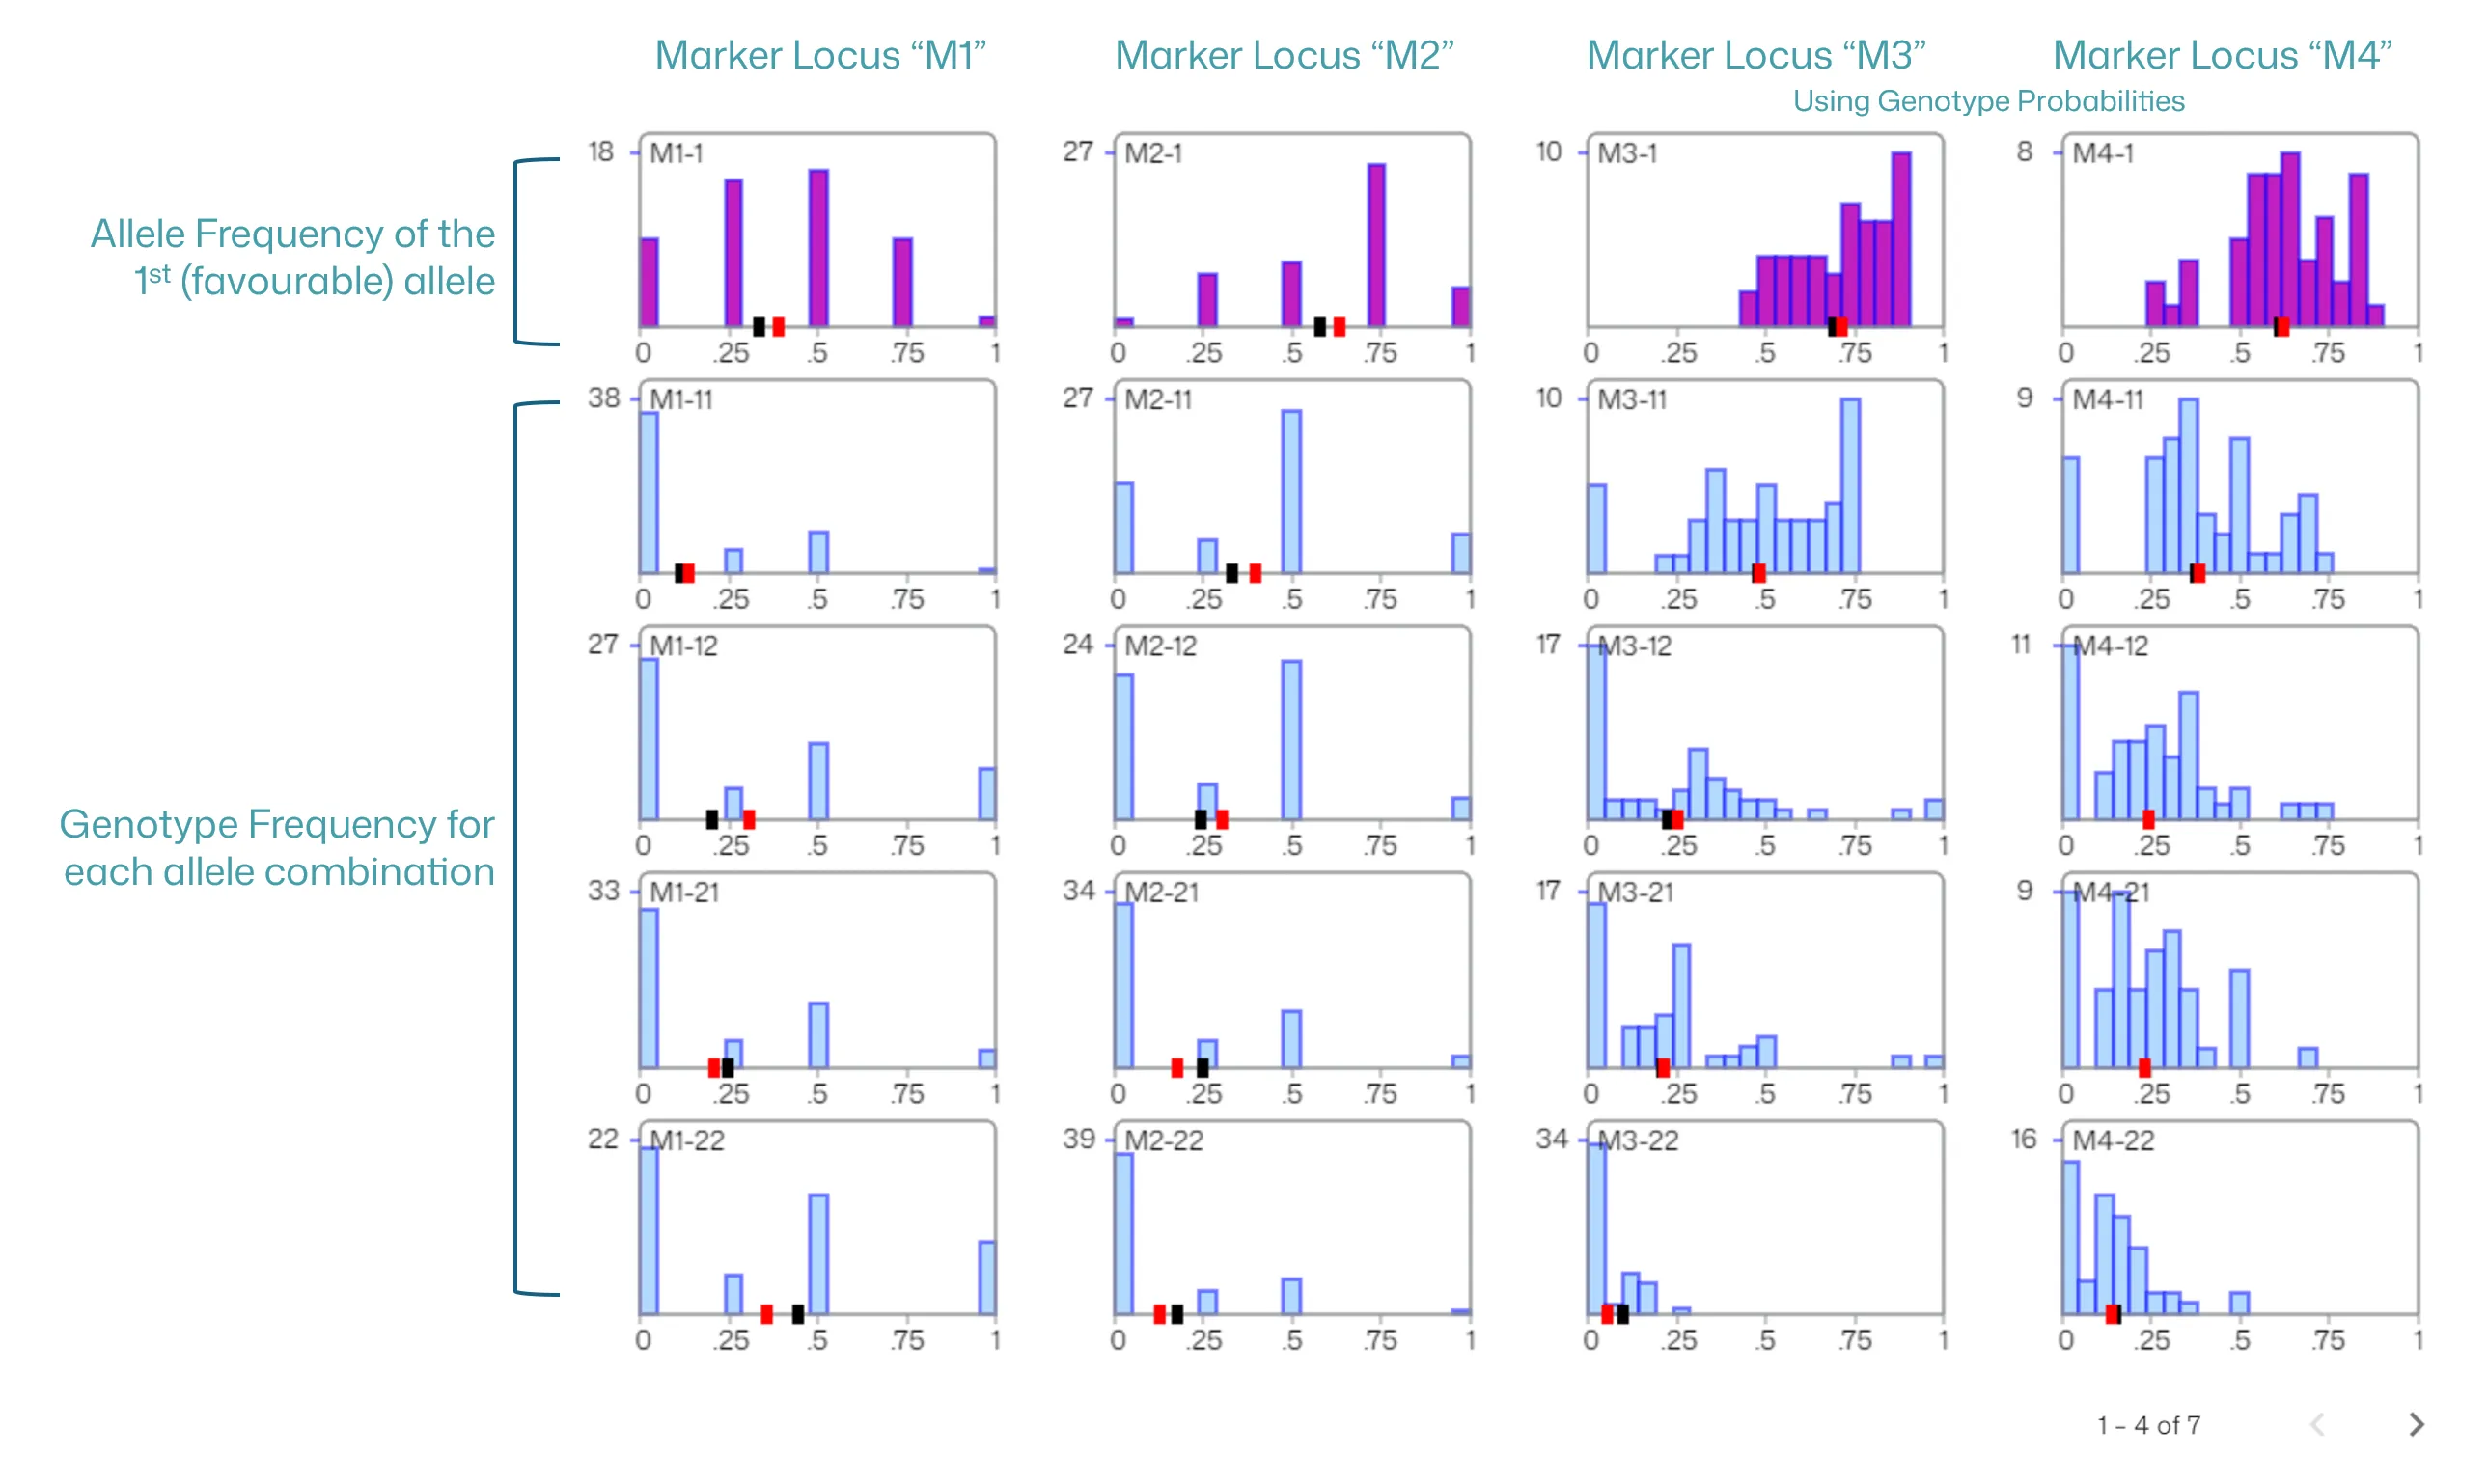
- The histograms show what we expect to find in the progeny given the matings we’ve got in the current solution.
- Each column of distributions relates to one marker locus.
- A maximum of 4 markers are shown at one time. If you have more than 4 markers, use the pagination controls at the bottom-right of screen to page through them.
- The top row of distributions shows the allele frequency distributions in the progeny for the first allele at each locus (column).
- The remaining rows show the genotype frequencies for the 4 (n*n) genotypes for the 2 (n) alleles at each marker locus. The system can handle any number of alleles, but of course the number of rows of graphs becomes high for n>2.
- In the example above, the first two markers are presented as genotypes in the input file, and the second pair of markers have genotype probabilities presented in the input file. For markers 1 and 2, prospective progeny do not always have certain genotypes – only their parents have known genotypes.
Managing Marker Outcomes
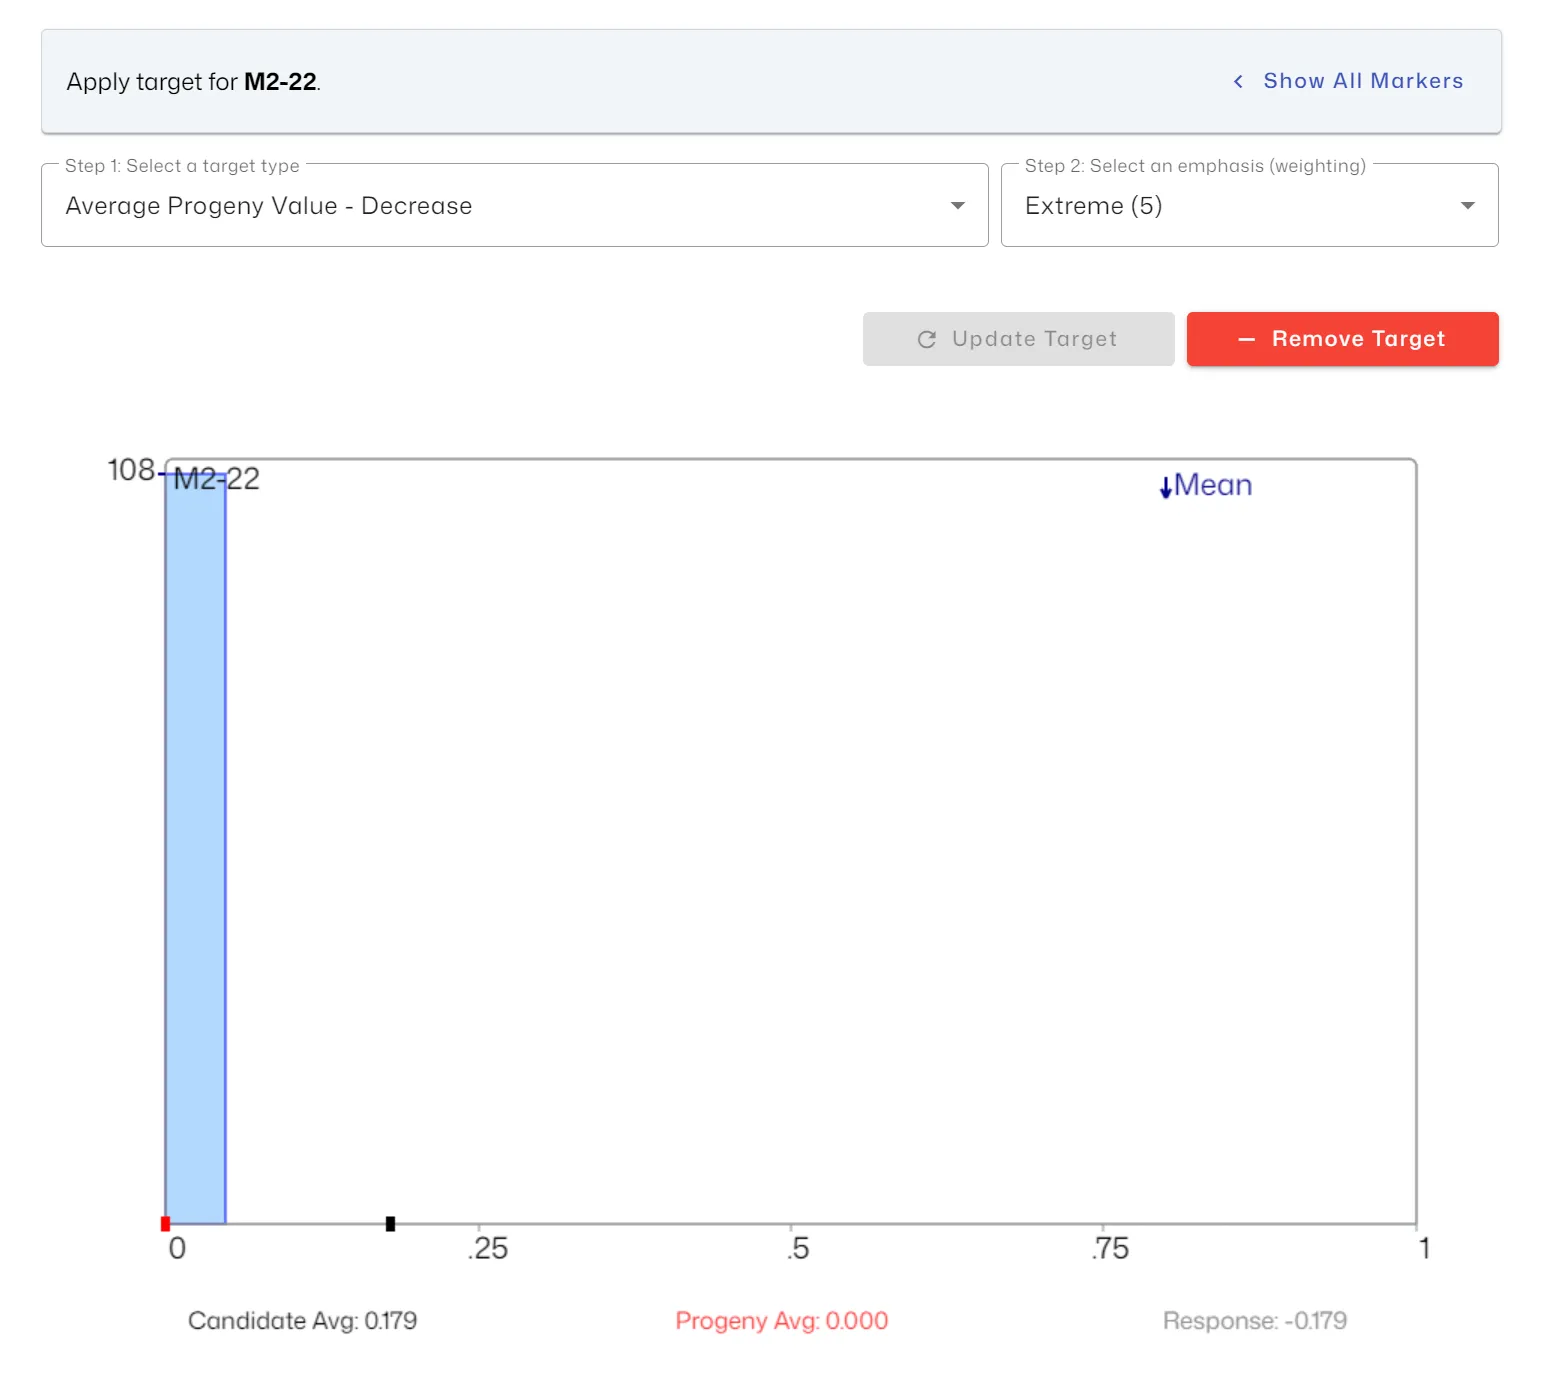
Section titled “Managing Marker Outcomes”Clicking a single marker histogram will go to the “detail” view for the selected histogram. The detail view allows you to:
- See the Candidate Average
- See the Progeny Average
- See the Marker Response (Candidate Average vs Progeny Average)
- Manage Marker Outcomes. These are managed in the same way as trait outcomes. See Setting Trait and Marker Targets. As always, after applying a target in MateSel, it is important to review the impact on your selection index, traits, other markers, and other outcomes such as progeny inbreeding.
Allele and Genotype Frequencies Dashboard
Section titled “Allele and Genotype Frequencies Dashboard”To view the summary of all allele and genotype frequencies for the current mating solution, navigate to the “Matings” tab and select the “Marker Frequencies” Dashboard.