Results
This page describes the outputs available after the MEU analysis has started. An important note is the scaling on the Frontier is different for MEU as it accommodates multiple objectives.
Frontier Scaling
Section titled “Frontier Scaling”The scales on the Frontier graph are as follows:
- Progeny Index: This is the mean across all matings of the progeny merit for the prevailing EndUse Index after application of the Genetic Gain Emphasis specified for each EndUse. The scale will range approximately from 0.5 (average selections) to somewhere below 1 (top scaled index values), unless negative weightings are involved.
- Parental Coancestry: The coancestry for each population is the unweighted x’Ax/2 across the EndUses it contains.
Mating List
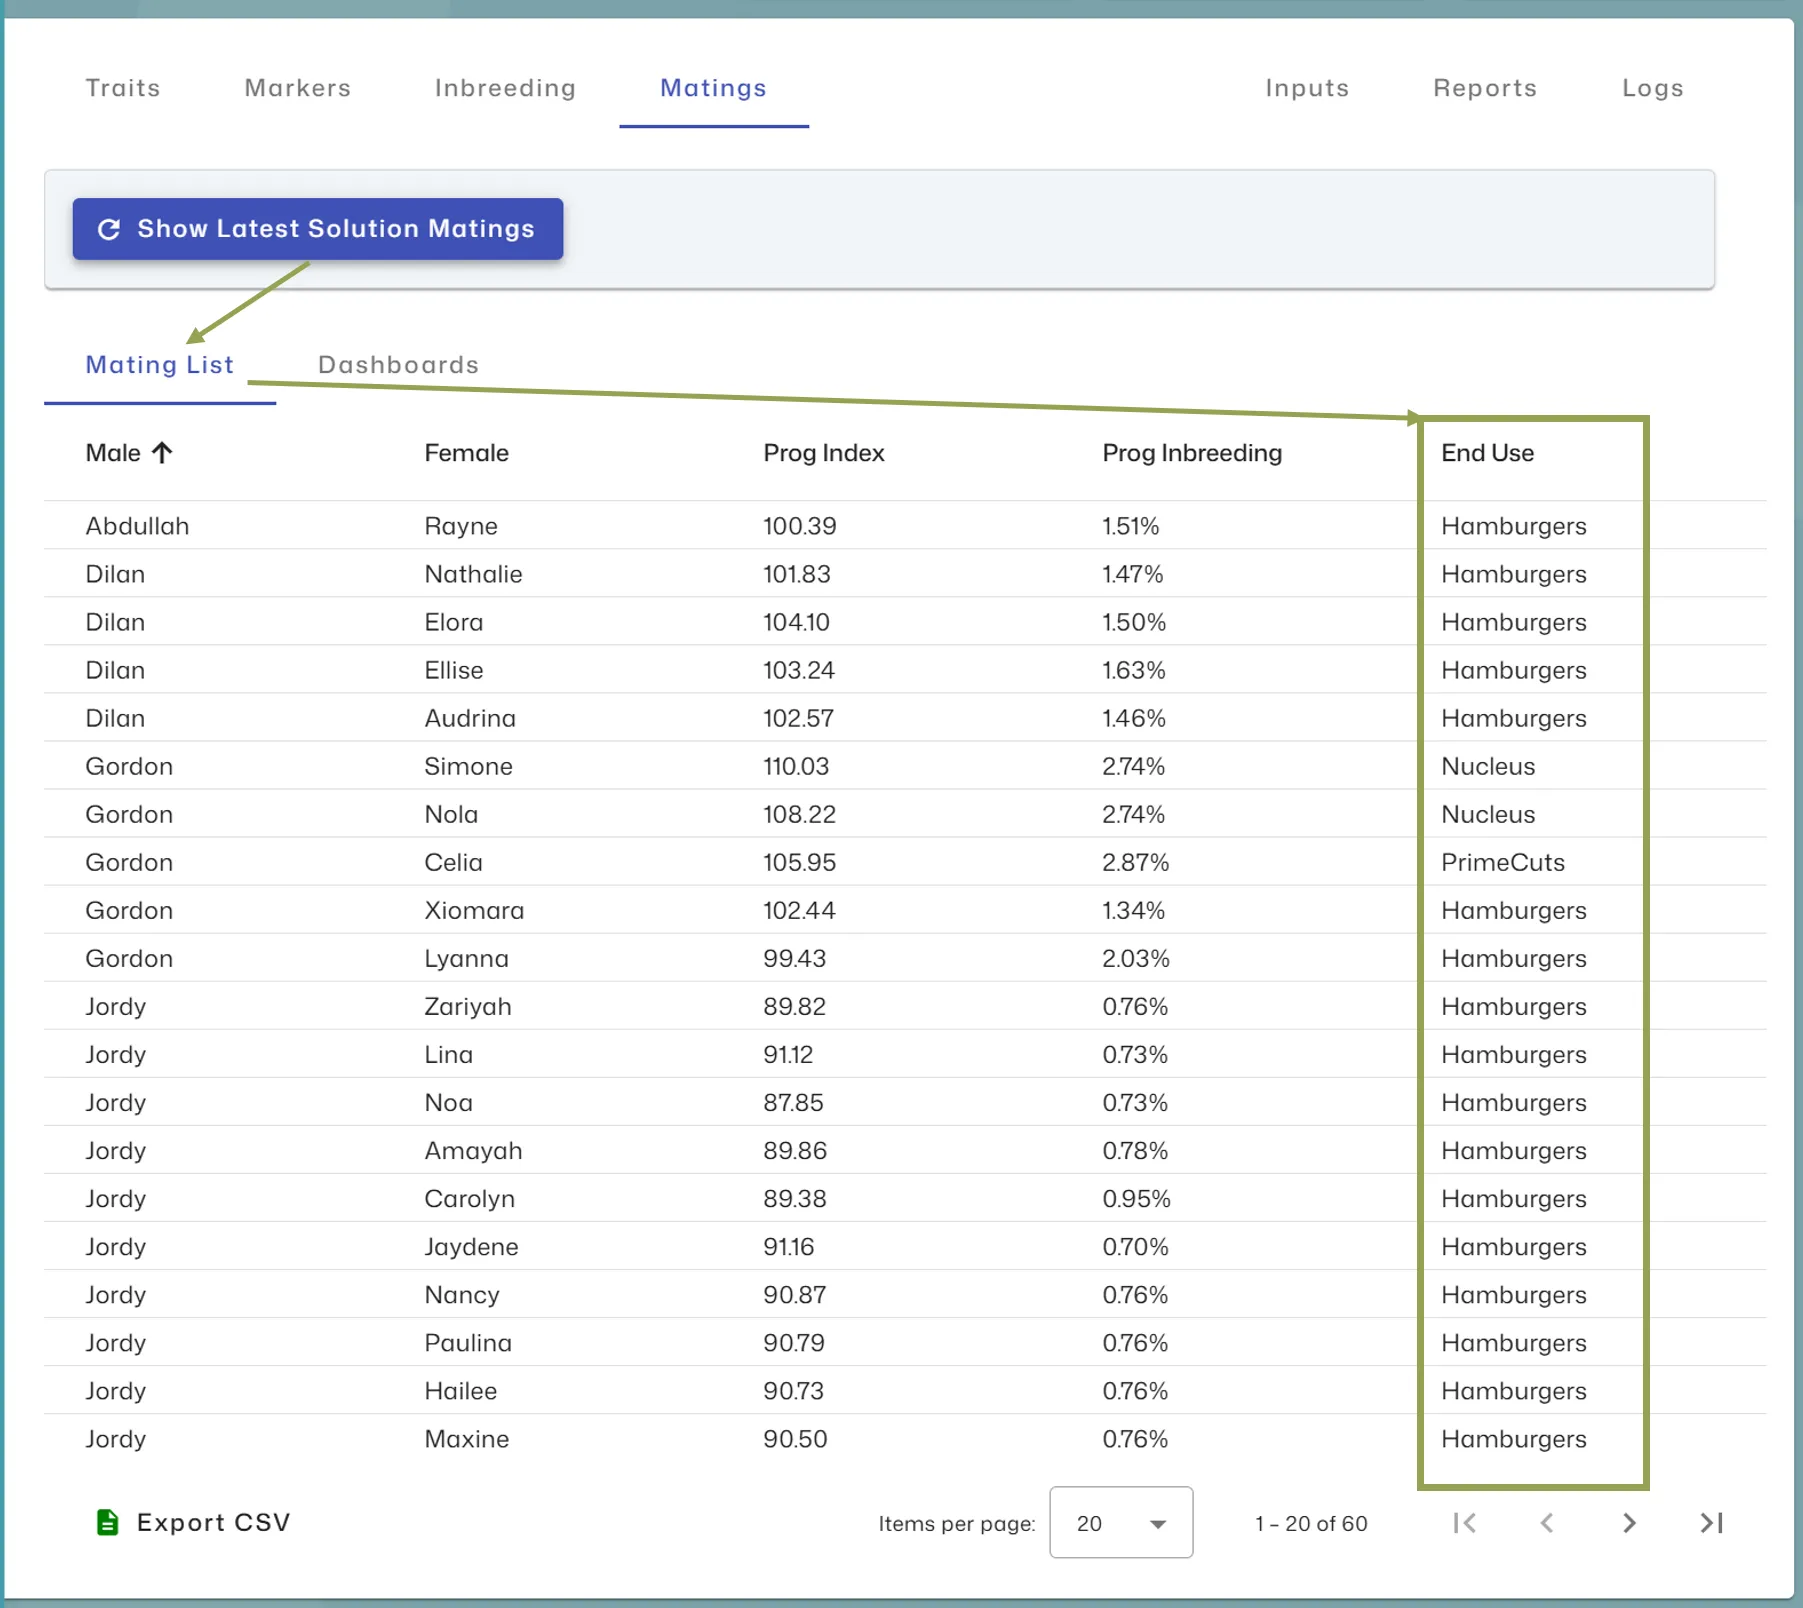
Section titled “Mating List”An additional End Use column is available on the Mating List grid showing the EndUse allocation for each mating to be made. Clicking on the column header will sort by that column.
EndUse Summary
Section titled “EndUse Summary”The EndUse summary (shown below) displays the predicted mean outcome for index, traits, marker allele and genotype frequencies, inbreeding, and coancestry for each EndUse.
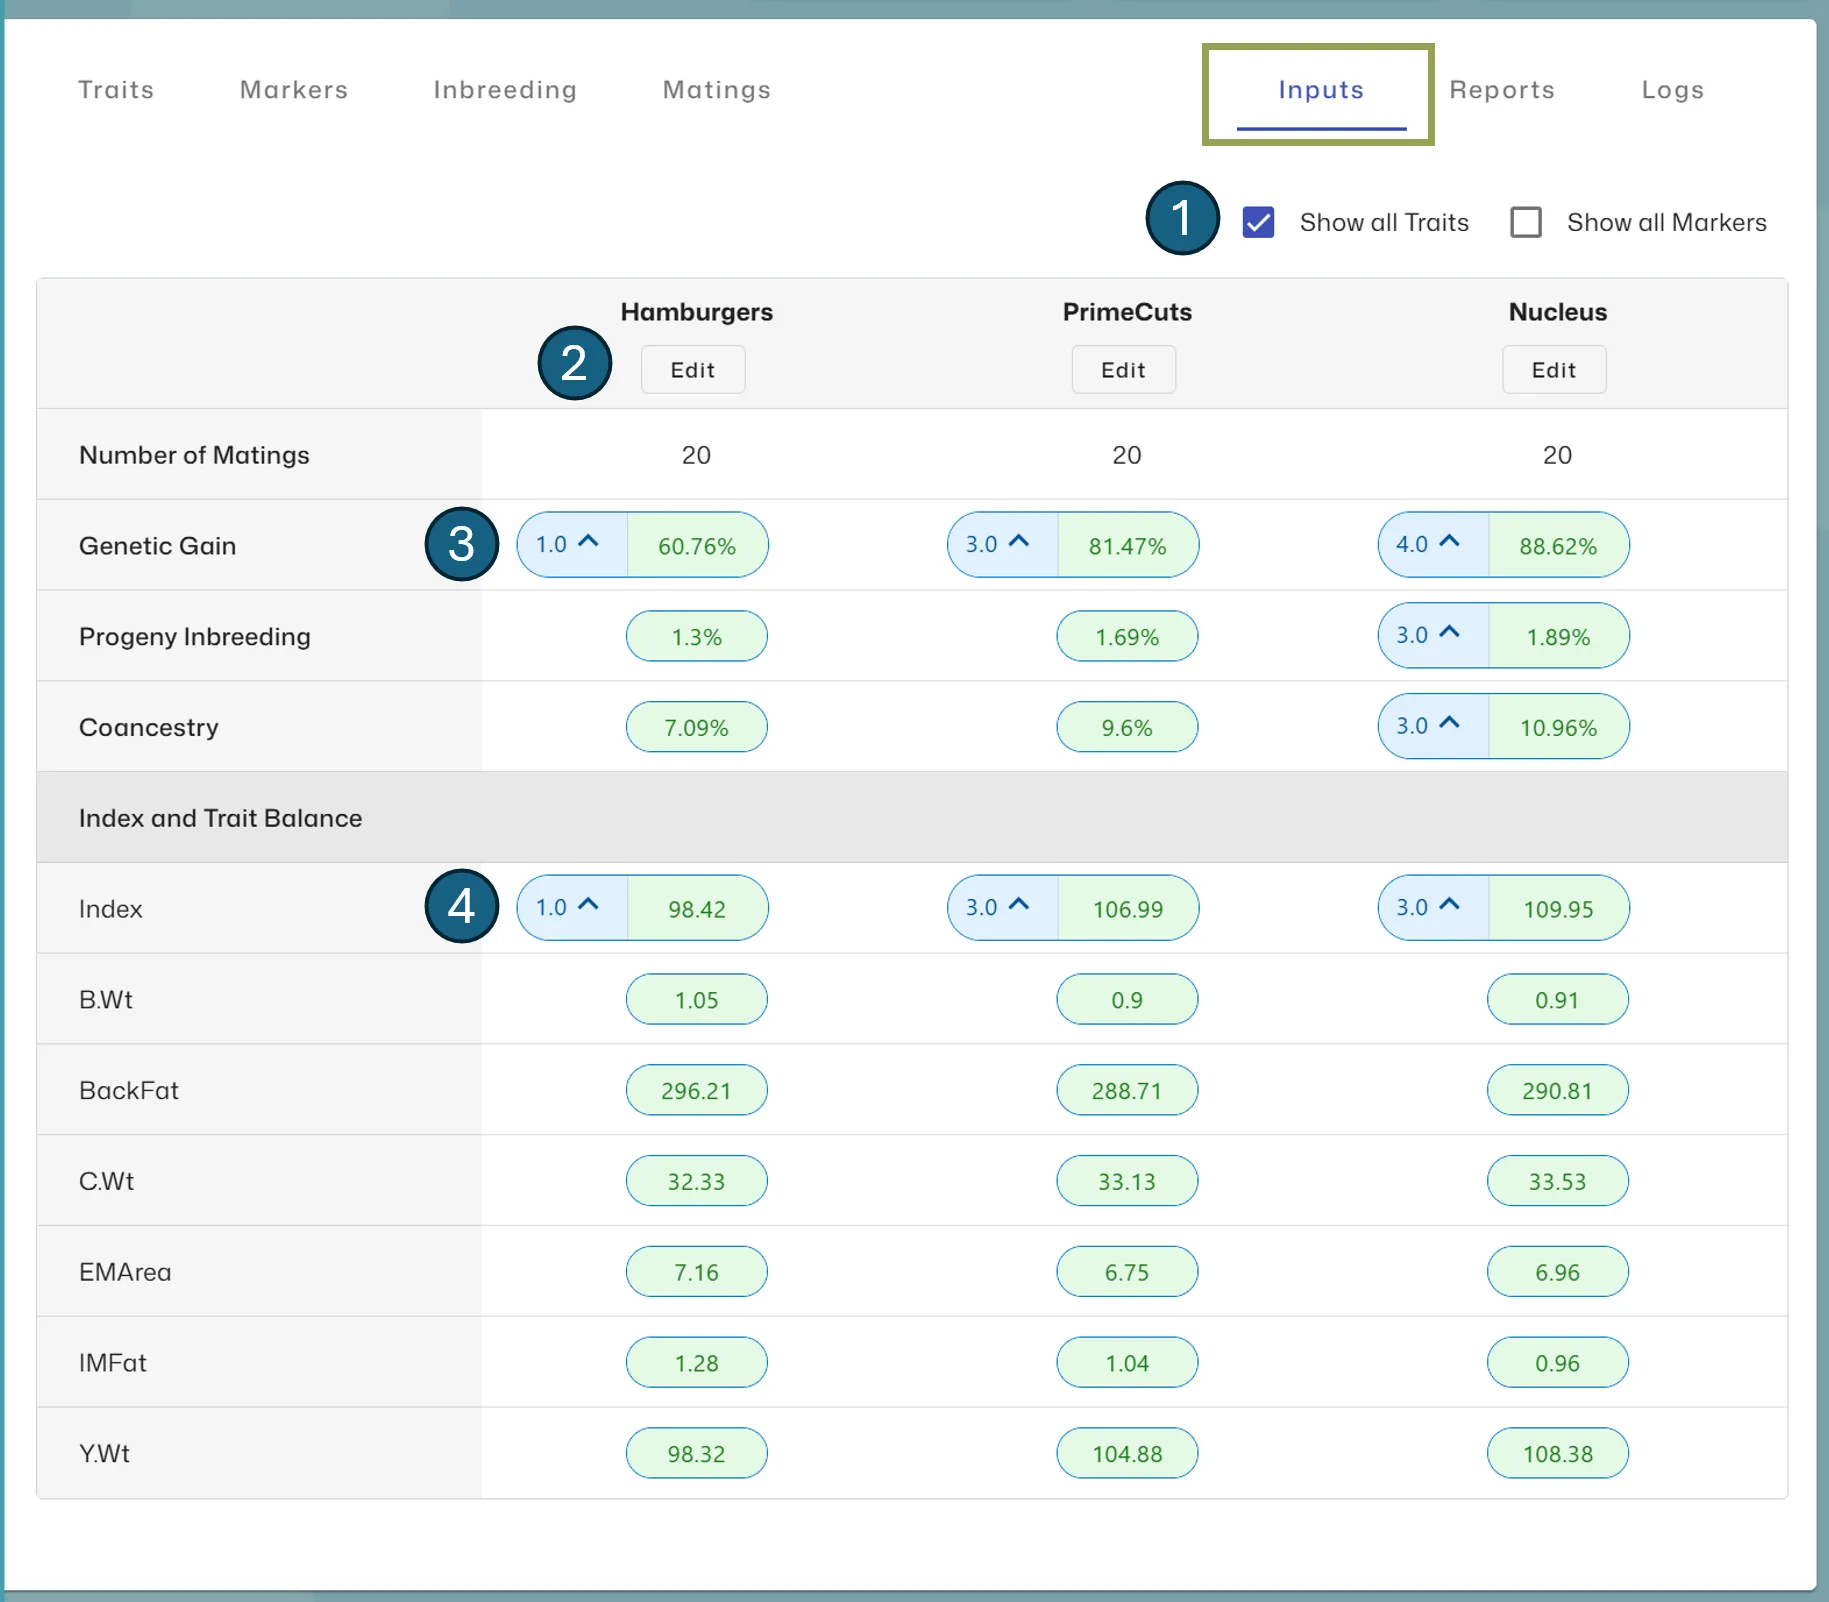
- Use the Show Traits and Show Markers checkboxes to toggle the display of this information
- Click the Edit button under an EndUse to change or tweak the direction for each EndUse
- The blue indicators next to the results highlight where you have applied a target, including the emphasis value and direction (increase or decrease mean value)
- If you include Index in one or more EndUse’s, the average index displayed in green is the true Index average, as opposed to the mean value against Genetic Gain which is scaled as described under the Frontier Scaling section above.
After stopping the run, you can download a PDF version of the EndUse summary table from the Reports tab.